
Before You Begin
- Anyone with access to your account can view Standard Reports. Some plans may not include the Reports module — if you don't see Reports in the left sidebar, ask an admin or check your subscription.
- Standard Reports are read-only. To build your own report layout from scratch, use the Custom Reports designer instead (see Designing a Custom Report).
- Related articles:
What are Standard Reports?
Standard Reports are pre-configured views that summarize your data for the most common use cases — without you needing to build anything. Each report combines:
- KPI cards at the top showing key totals at a glance.
- A data grid below with sortable columns and an Export button.
- No editing required — the report is ready to read the moment you open it.
Step-by-Step Instructions
Step 1: Open the Standard Reports library
- From the left sidebar, click Reports.
- Click Standard Reports.
You'll see the report catalog, organized by section.
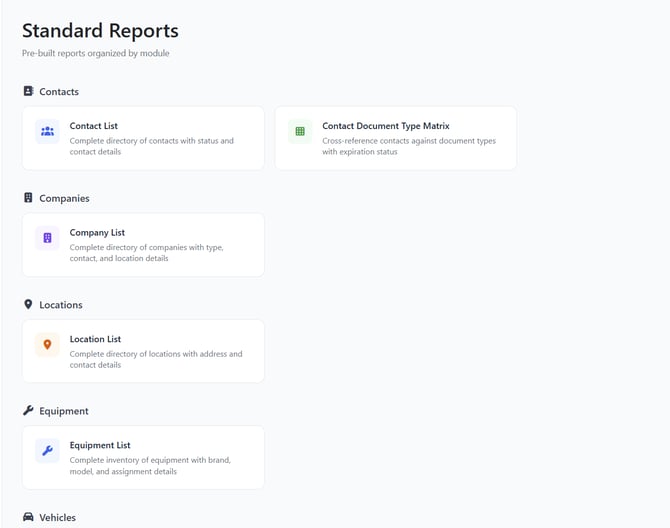
Step 2: Pick a report
The catalog is grouped into sections so you can quickly find what you need:
- Contacts
- Contact List Report — Every contact in your account, with email, phone, type, locations, and owner.
- Contact/Category Matrix Report — A grid that shows which contacts hold which document types, color-coded by expiration status.
- Companies
- Company List Report — Every company in your account, with company type, primary contact, location, and owner.
- Locations
- Location List Report — Every location, including parent location, address, primary contact, and status.
- Equipment
- Equipment List Report — Every piece of equipment, including brand, model, type, and current assignment.
- Vehicles
- Vehicle List Report — Every vehicle, including make, model, year, VIN, license plate, and current assignment.
- Document Types
- Document Type Compliance — Compliance percentages by document type. See the dedicated Document Type Compliance Report article.
- Safety Meetings
- Completion by Site, Attendance Report, Employee Meeting History, Compliance Gap Report, and Topic Coverage Report.
Click any card to open that report.
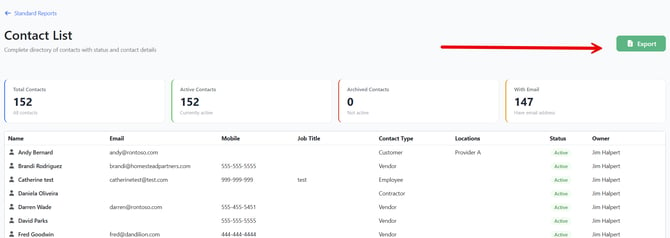
Step 3: Read the KPI cards
Every list report shows four KPI cards at the top. The KPIs vary by report, but a typical setup is:
- A blue card with the total record count.
- A green card with the count of active records.
- A red card with the count of archived or inactive records.
- An orange card highlighting a useful subset (for example, contacts with an email address on file).
Step 4: Sort, search, and explore the grid
- Click any column header to sort by that column. Click again to reverse the order.
- Scroll horizontally if the report has more columns than fit on screen.
- Each report loads up to 50,000 rows at once, so very large accounts may want to filter the underlying records first (for example, archive old contacts) before opening the report.
Step 5: Export to Excel
- Click the green Export button (Excel icon) at the top right of the report.
- The browser downloads an
.xlsxfile you can open in Excel or Google Sheets. - The export contains the same columns shown in the grid.
Step 6: Return to the catalog
Click the ← Standard Reports link in the upper-left of the report to go back and choose a different one.
Tips & Best Practices
- Bookmark your favorites. Each Standard Report has a stable URL (for example,
/report/contact/list). Bookmark the ones you check often so you don't have to navigate through the catalog each time. - Use the matrix report for compliance reviews. The Contact/Category Matrix Report is the fastest way to see which contacts are missing required documents — see Contact/Category Matrix Report.
- Pair with Custom Reports. Standard Reports cover the most common questions. If you need a different column layout, grouping, or filter, build a one-time view in the Custom Report Designer instead.
- Schedule recurring exports. If your team needs the same report every Monday, use Scheduling Reports to email it on a schedule.
Troubleshooting
- Issue: A KPI card shows 0 even though I know the data exists.
Solution: Refresh the page. Standard Reports query live data on page load — there is no manual refresh button on the report itself. - Issue: I can't find the Reports menu in the left sidebar.
Solution: Your account may not include the Reports module, or your role may not have report access. Contact your account admin. - Issue: The Export button does nothing.
Solution: Check your browser's pop-up/download blocker. The export downloads directly without opening a new tab, but some browsers may block the file silently. - Issue: My large account times out when loading a report.
Solution: Try archiving records you no longer need, then reload. If the issue persists, contact support — they can help split the dataset.