
Before You Begin
- Anyone with access to Reports can open these reports.
- Each report loads up to 50,000 rows of its asset type, sorted by name.
- Related articles:
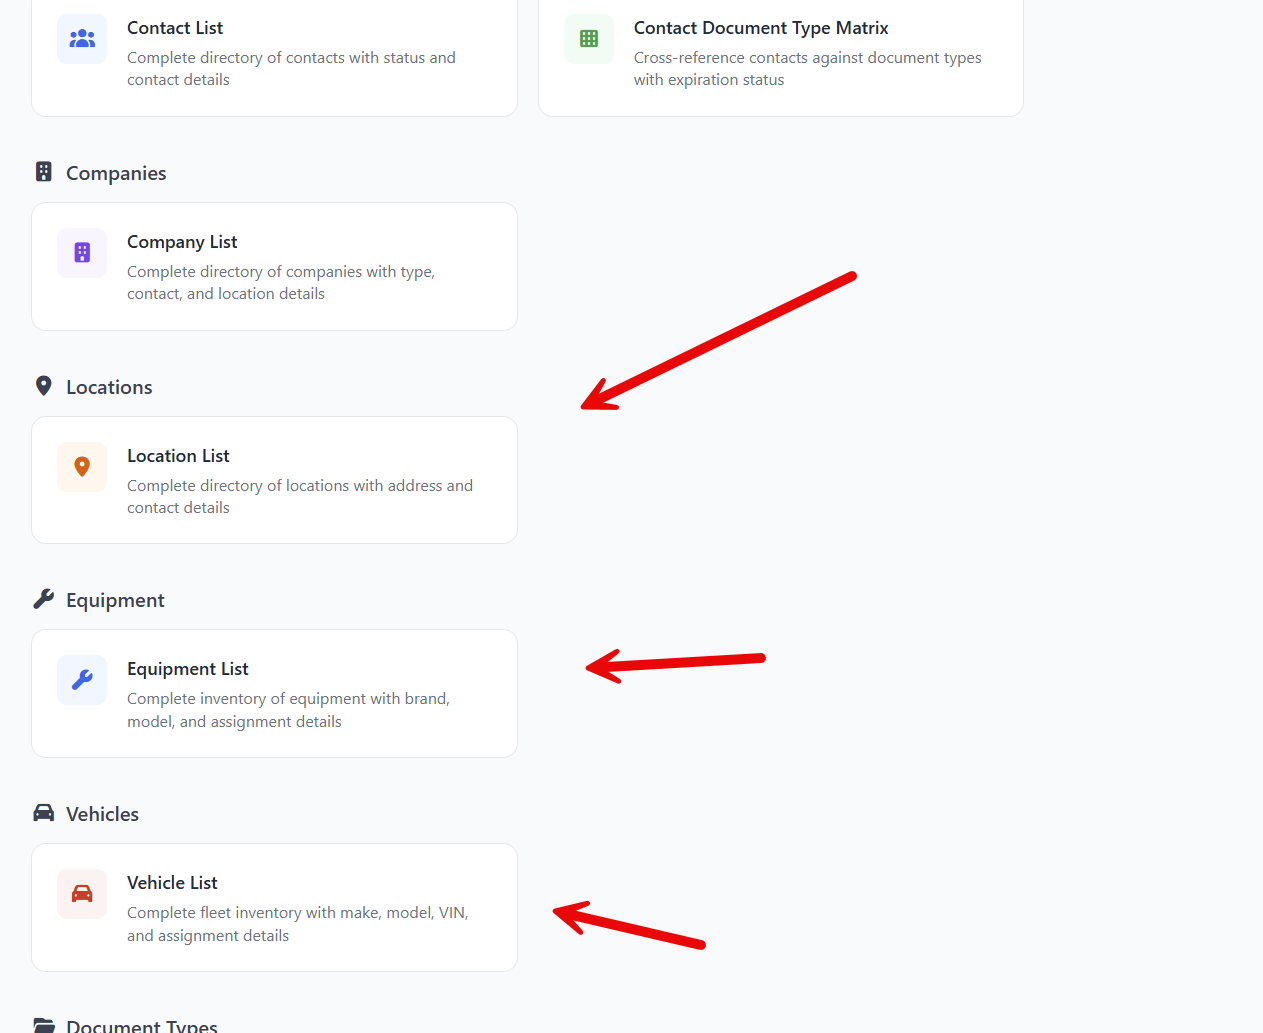
Open any of the three reports
- From the left sidebar, click Reports.
- Click Standard Reports.
- Click the card for the asset type you want:
- Location List Report (under Locations)
- Equipment List Report (under Equipment)
- Vehicle List Report (under Vehicles)
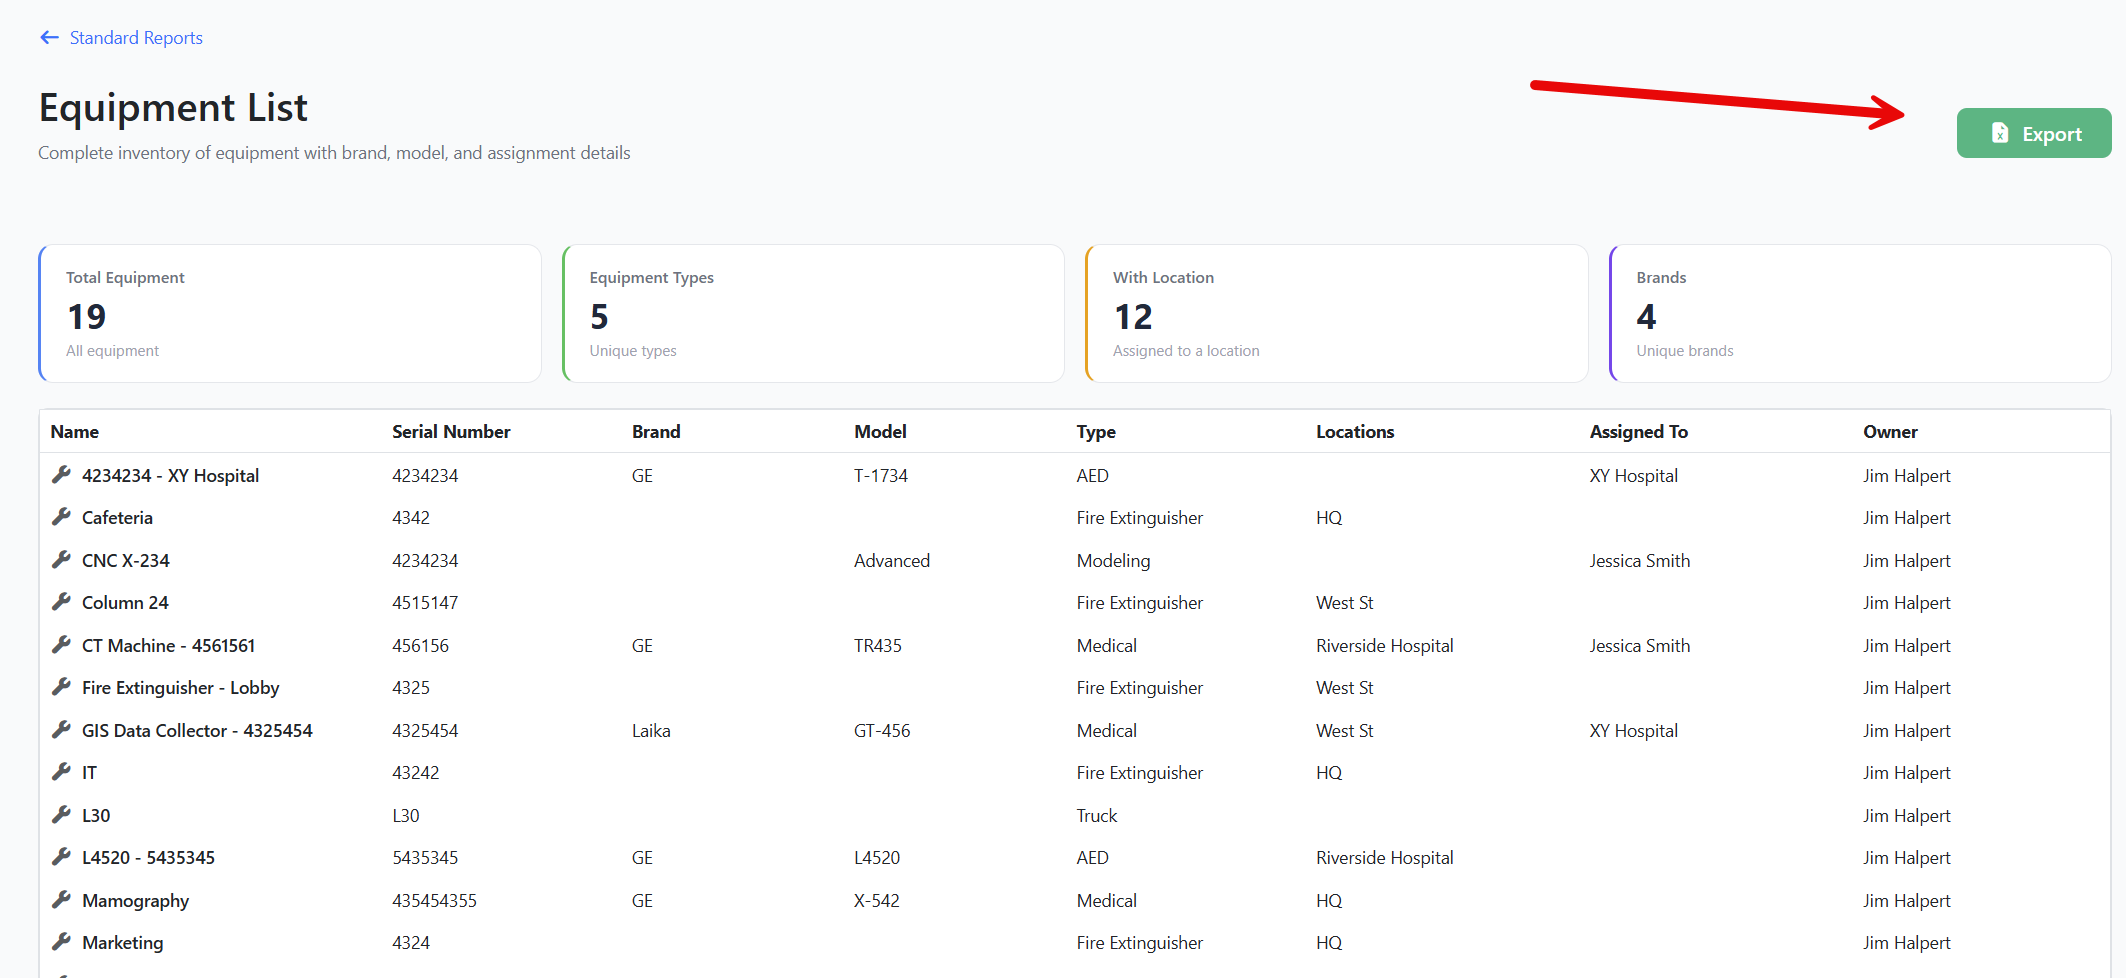
Each report follows the same layout: a back link, the title and description, KPI cards across the top, and a grid with an Export button.
Location List Report
Columns
| Column | What it shows |
|---|---|
| Name | Location name. |
| Parent Location | The location's parent in your hierarchy (blank if it's a top-level location). |
| Code | Internal code or identifier you assigned. |
| Address, City, Province | Address fields. |
| Primary Contact | The contact responsible for this location. |
| Status | Active (green) or Inactive (red). |
| Owner | The user who owns this location. |
KPI cards
- Total Locations — every location in the account.
- Active Locations — locations not marked inactive.
- Inactive Locations — locations marked inactive.
- With Primary Contact — locations that have a primary contact.
Equipment List Report
Columns
| Column | What it shows |
|---|---|
| Name | Equipment name. |
| Equipment Number | Asset tag or internal number. |
| Brand | Manufacturer. |
| Model | Model designation. |
| Type | The equipment type your admins created (for example, Forklift, Generator). |
| Locations | Comma-separated list of locations the equipment is linked to. |
| Assigned To | The contact currently assigned to this equipment. |
| Owner | The user who owns this equipment. |
KPI cards
- Total Equipment — every piece of equipment in the account.
- Equipment Types — number of unique types in use.
- With Location — equipment that has at least one location.
- Brands — number of unique brands in use.
Vehicle List Report
Columns
| Column | What it shows |
|---|---|
| Name | Vehicle name or nickname. |
| Make | Manufacturer. |
| Model | Model name. |
| Year | Model year. |
| VIN | Vehicle Identification Number. |
| License Plate | Plate number. |
| Vehicle Type | Type label your admins created. |
| Locations | Comma-separated list of locations the vehicle is linked to. |
| Assigned To | The contact currently assigned to drive this vehicle. |
KPI cards
- Total Vehicles — every vehicle in the account.
- Makes — number of unique makes.
- With Location — vehicles that have at least one location.
- Vehicle Types — number of unique vehicle types.
Step-by-Step Instructions
Step 1: Review the KPI cards
Glance at the four cards at the top to see totals and the most useful subsets at a glance.
Step 2: Sort or scroll the grid
- Click any column header to sort. Click again to flip the sort direction.
- Scroll right if a column you need is offscreen.
Step 3: Export to Excel
- Click the green Export button (Excel icon) in the upper right.
- The browser downloads an
.xlsxfile matching the columns shown. - Open it in Excel or Google Sheets.
Step 4: Return to the catalog
Click the ← Standard Reports link in the upper-left to choose another report.
Tips & Best Practices
- Find assets without an assignment. Sort by Assigned To ascending — blanks float to the top so you can quickly see which equipment or vehicles are unused.
- Audit asset codes. Use the Equipment Number, VIN, or License Plate columns to spot blanks or typos. Empty asset numbers make tracking harder later.
- Spot orphaned locations. Locations with no Primary Contact are good candidates for cleanup or reassignment.
- Use exports for insurance reviews. Many insurance carriers ask for an annual asset roster — the Vehicle and Equipment List Reports are tailor-made for this.
Troubleshooting
- Issue: A piece of equipment / vehicle shows no Location.
Solution: Open the equipment or vehicle in the main app and add it to one or more locations. The report uses the linked locations to populate the Locations column. - Issue: The Brand or Make KPI counts don't match what I expect.
Solution: These KPIs count unique non-blank values. If two records have the same brand spelled differently ("Ford" vs. "ford"), they'll be counted as two separate brands. Clean up your data for accurate counts. - Issue: A vehicle's Assigned To shows blank even though I assigned a driver yesterday.
Solution: Refresh the page. The report queries live data on page load. If the assignment was made in another browser tab, this tab still has the previous snapshot until you reload.